“No amount of clever marketing tricks, product design patterns or user interface (UI) trends will ever outperform leveraging the basic knowledge of how your audience perceives their current situation, and how they would like it improved.” – Samuel Hulick, UserOnboard Founder
A lot of different analyses can help reveal leaks in your product engagement funnel.
Surely a business has to address all challenges at once if it’s going to grow fast? That’s the reason why businesses raise capital and hire people, right?
Looking at the trend of businesses post-product-market fit burning capital, hiring too fast, this would seem like the thing to do, but the reality is actually quite different.
It has been proven that goals are best achieved sequentially. As a business, it pays to focus on a North Star metric, or on one or two key goals at a time. This way, it becomes easier to evaluate performance and to understand which actions drive results. Teams get to focus more energy on fewer goals, which makes it easier for them to understand what really matters.
Evaluating Product Engagement With the AARRR Framework
Entrepreneur and investor Dave McClure created the AARRR framework, also known as Pirate Metrics, to make this idea clear.
In McClure’s model, innovators measure how users go through five key steps of the customer life cycle:
- Acquisition: visitors entering the funnel through various channels
- Activation: visitors enjoying a first experience with the product
- Revenue: users purchasing the product, becoming customers
- Retention: users coming back, becoming loyal customers
- Referral: users or customers referring the product to friends or colleagues
A prospect gets Acquired, he/she is then Activated, converted for Revenue, Retained, and if the experience is positive, he/she can Refer the product (Note that in McClure’s model, Revenue is the last step).
By tracking the full life cycle as a funnel and evaluating cohorts of users, it becomes easier to identify break points.
A funnel for a product might look a bit like this:
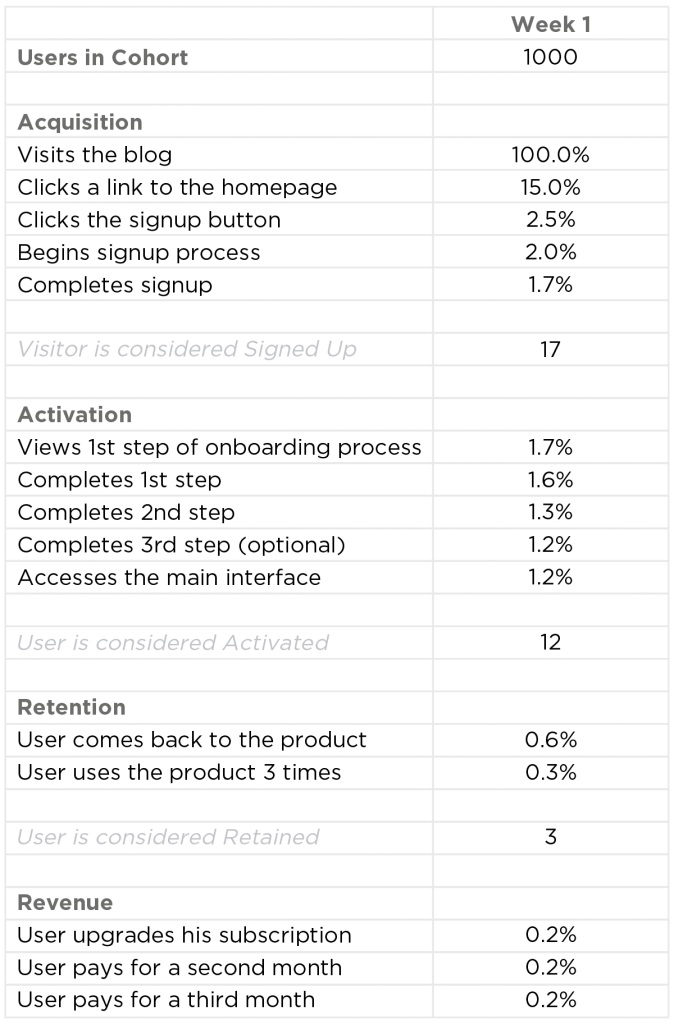
The questions this funnel help answer are, for example: Of the people that visited the blog (1,000), how many also visited the homepage (150)? Clicked the sign-up button (25)? Actually completed the sign-up process (17)?
By looking at the drop from one step to the next and comparing data with both internal and external benchmarks, you should be able to find the bottlenecks—opportunities to both learn and improve performance.
How to Fix the Leaks in Your Funnel
Once you have identified a drop off, you should analyze the step through various lenses, for example:
- Do users acquired through different channels behave differently?
- Are there regions, countries, or cities that perform better than others?
- Can users on mobile, tablet, or desktop complete the same tasks?
- Are there considerations in terms of site performance?
This will help you create hypotheses for improvements and experiments.
To make progress, focus on one or two main goals, make improvements, and iterate. Once you begin to get results, move on to the next break point.
By following this process, you’ll be able to continuously grow performance across the entire customer journey.
– –
This post in an excerpt from Solving Product. If you enjoyed the content, you'll love the new book. You can download the first 3 chapters here →.