“If the key behavior in your product does not occur within the frequency of a week’s time or less, it will be very difficult to change your user’s habit.” – Nir Eyal, Author of Hooked and Indistractable
It’s easy to get carried away when you start instrumenting the analytics of your minimum viable product (MVP). You don’t know for sure where insights will come from, and as you have time available, it feels easy to add.
But, since you won’t have a lot of volume, and any analytics that you put in place will most likely be wrong, you’re better off focusing your efforts elsewhere.
In the early stage, you’ll learn more quickly from activity streams or user activity logs.

Analyzing product events user by user will help you get a feel for the flows, key actions, and break points in your product.
At this point, since it won’t be clear what meaningful retention is, overall retention numbers (e.g. how many people came back within the first seven days) will be too general to learn from.
Digging in the Product Events to Analyze Retention
To dig deeper, look at profiles one by one, focusing on feature usage and retention:
- Are users experiencing the core value of your product?
- Is this value what you had expected?
- How many steps are there between sign-up and first value? How long does it take?
- Are they completing their tasks?
- How often do they come back?
- Do they come back on their own?
- What are they doing when they come back?
- How well does the frequency of engagement map to the natural cadence of the Job users are performing?
Your goal is to get users to experience the product’s core value as quickly as possible. It will be very difficult to get good retention if your product’s “Aha moments”—the moments when users realize that the product is valuable—take a while to get to.
Establish a weekly cadence looking at the past week’s sign-ups, their activities, and the evolution of behaviors amongst cohorts from previous weeks.
Look at the sequence of product events: How far do they get inside your product? Are they performing the core actions? Are they getting blocked? Are they coming back? Are there things that they do that you don’t understand?
You can’t buy engagement. Resist the urge to look at aggregate data until you have a clear understanding of the small-scale patterns. In fact, it’s a good idea to keep doing this until it’s really no longer scalable.
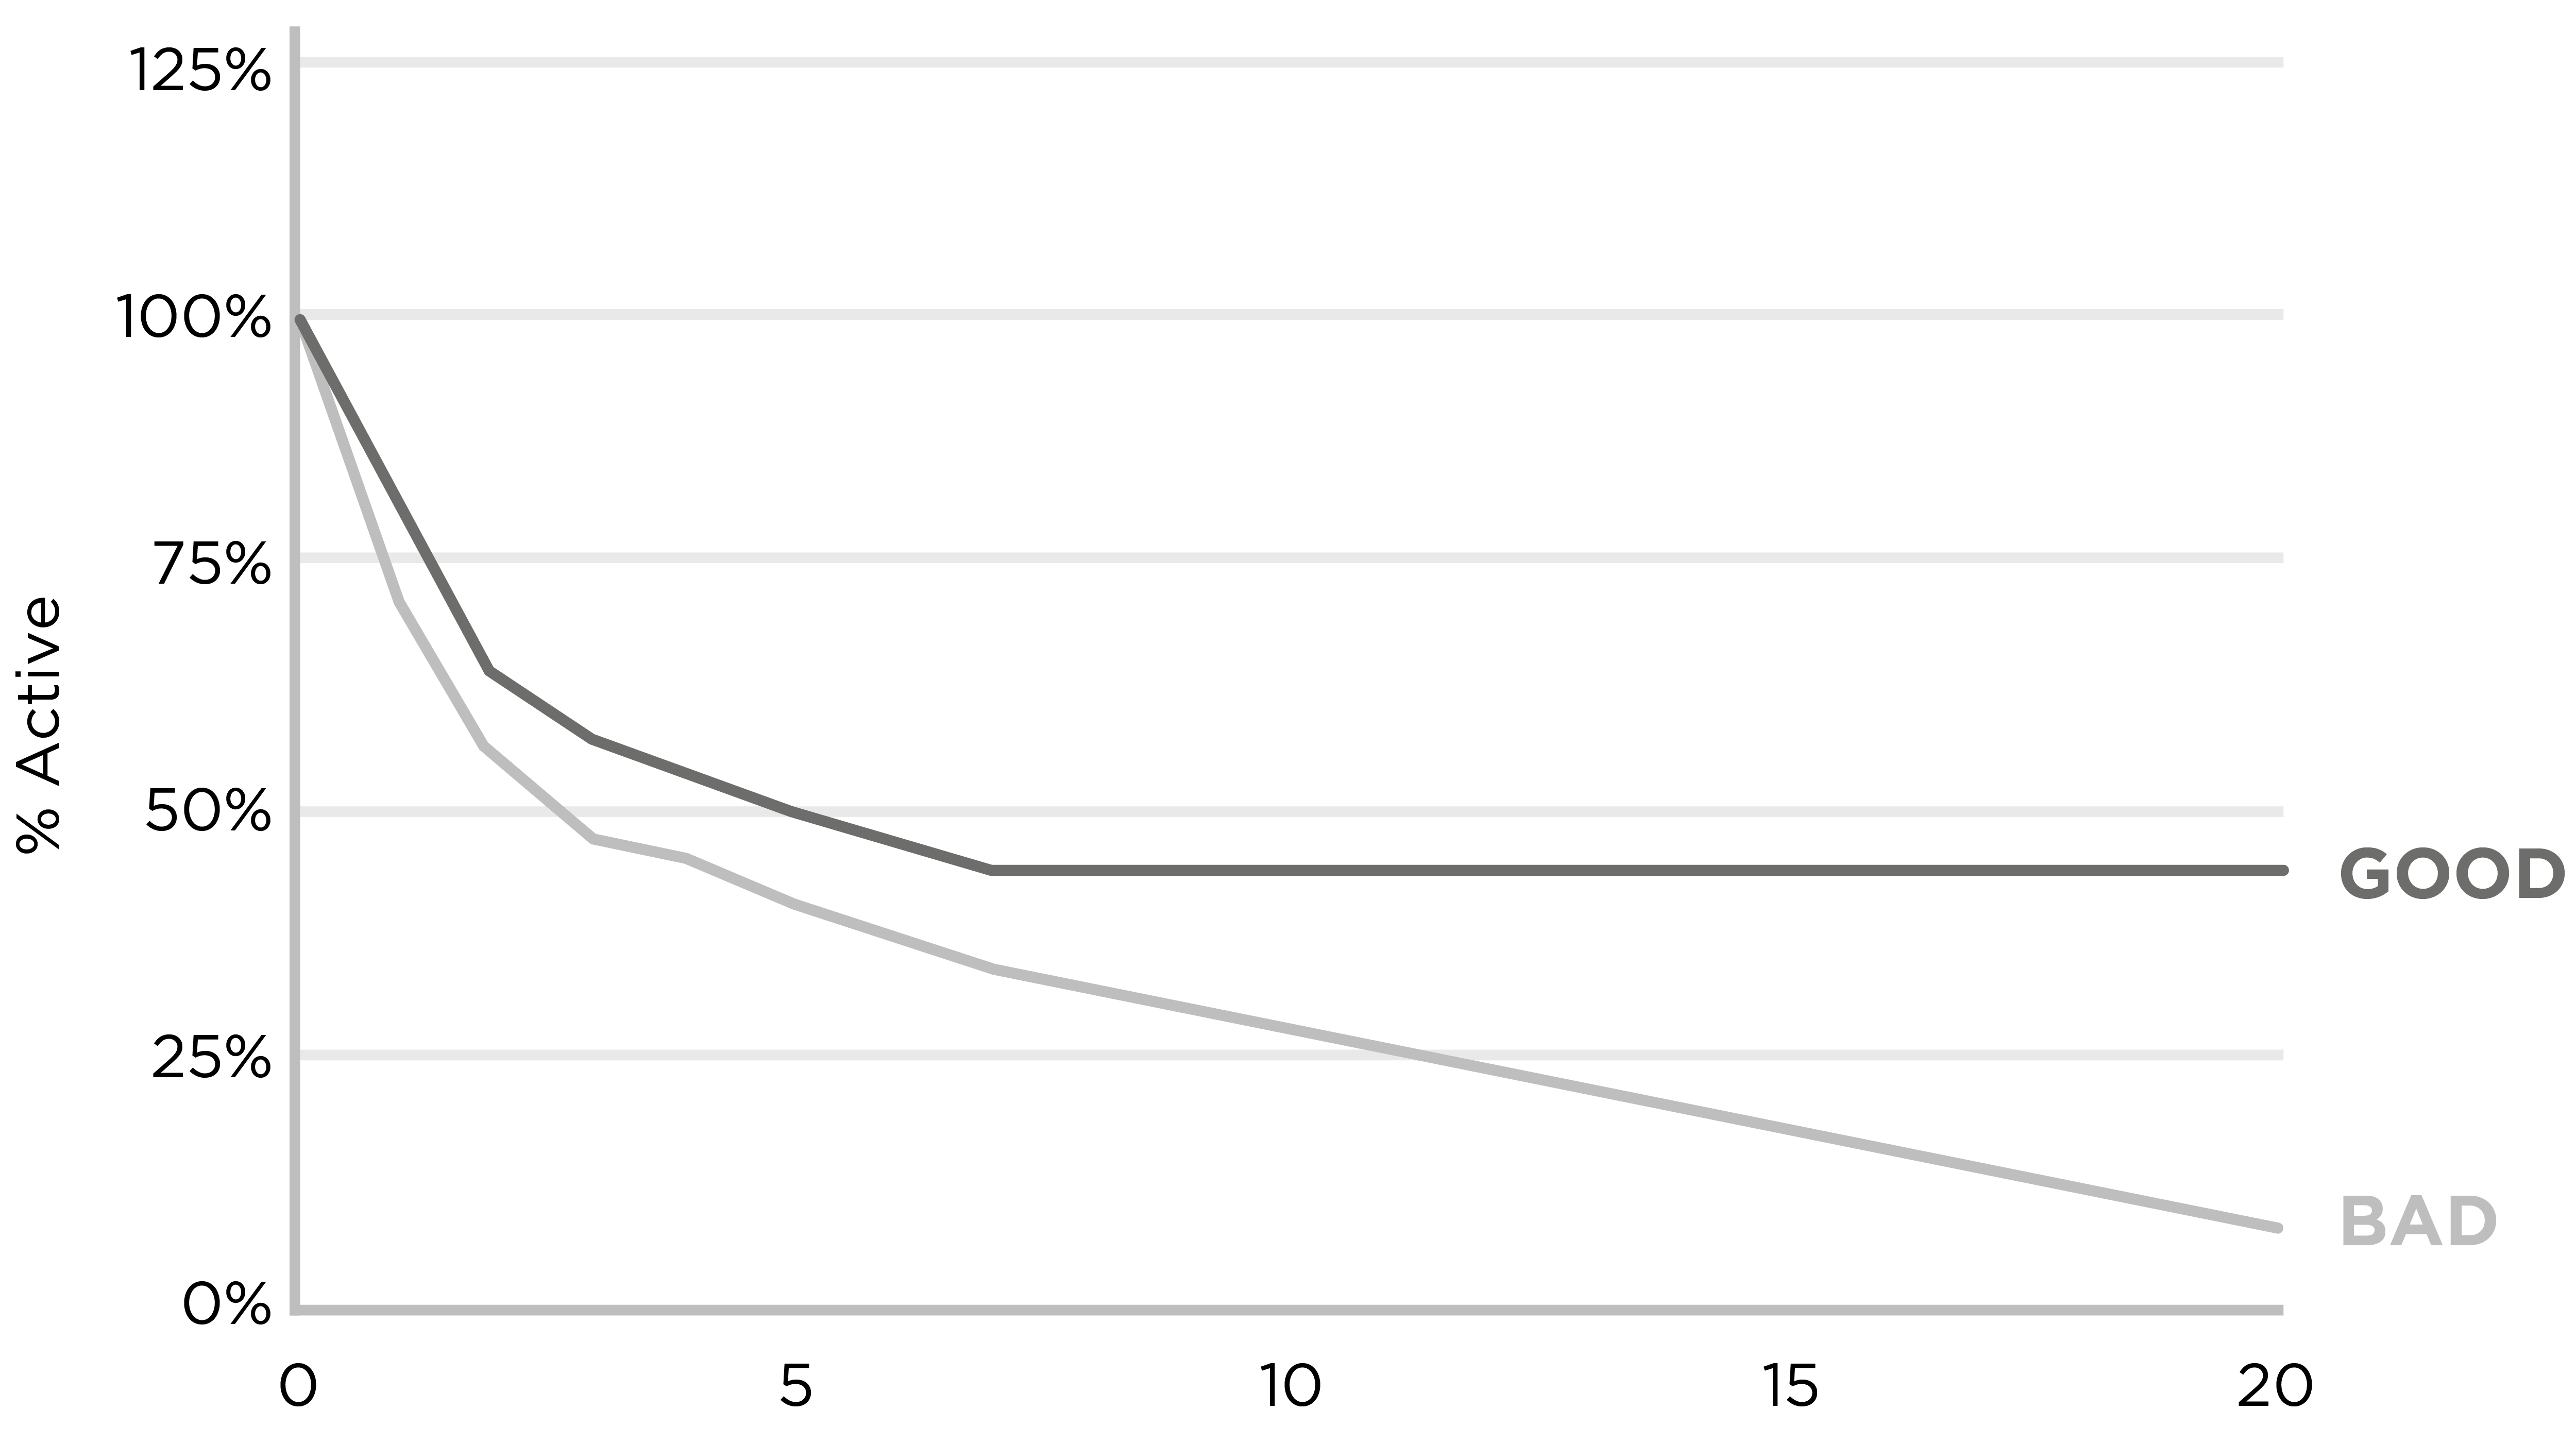
Iterate. Eventually, the retention curve should flatten.
– –
This post in an excerpt from Solving Product. If you enjoyed the content, you'll love the new book. You can download the first 3 chapters here →.