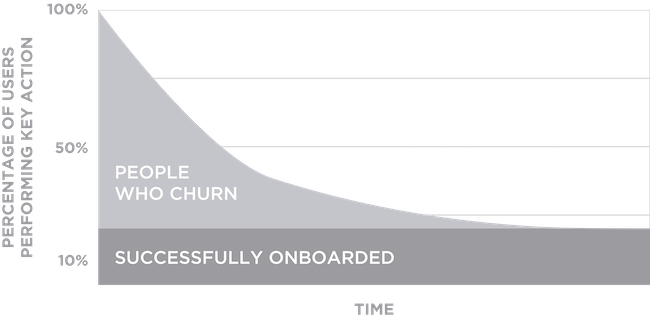
Plot the % active over time (for various retention cohorts) to create your retention curve. IF it flattens off at some point, you have probably found product/market fit (PMF) for some market or audience. – Brian Balfour, Reforge Founder & CEO
Several years ago, Facebook almost reached a 70% retention rate. At the time, and probably still to this day, this level of product stickiness had never been seen before.
Facebook, as a company that generates the bulk of its revenue from advertisements, has long understood the game it’s playing. Over the years, they have acquired two of the most engaging apps on the market (WhatsApp and Instagram), and have made several failed bids to buy another (Snapchat).
As Facebook (and Google) realized long ago, retention is key.
This goes well beyond ad-driven businesses. No matter what your product’s revenue model, becoming the go-to solution for a need in a market will help to ensure business success.
For retention cohorts, the important thing is that a percentage of users are making a habit of using your product.
What Successful Retention Looks Like
The key parts of retention are:
- The core action: The main action that signifies that users are getting value from your product.
- The frequency of use: How often should users receive value from the product. The frequency of use should align with the frequency of the Job that your product helps facilitate.
Nir Eyal, the author of Hooked, defines retained users as habituated users.
The specific definition of a habituated user will be based on the type of product you have built.
- If your product is a social network, a habituated user might be someone who checks in every day.
- If you’re building enterprise software, a habituated user might be someone who performs a certain task every morning.
- If it’s tax preparation software, a habituated user might only use the product once a year.
The important thing is that there is a regular cadence of use.
How to Evaluate Product/Market Fit Using Retention Cohorts
To assess your product’s retention cohorts, check the percentage of users whose usage matches the expected frequency of use for your product.
As Nir mentioned during our interview, you probably don’t have PMF if less than five percent of your users are habituated.
Once you start seeing five, 10 or 15 percent of sign-ups stick around and become habituated, this generally means that you’re starting to have some level of PMF.
Look at your ideal customers: Are at least 10% of them habituated? Is your product driving ongoing usage?
More on Retention Cohorts
- How to Iterate Product Value to Reach Product/Market Fit In B2B
- How to Use the Product/Market Fit Survey to Evaluate Your Product’s Market Fit
- How a Win/Loss Analysis Can Help You Find Product/Market Fit

Download the First 4 Chapters Free
Learn the major differences between B2B and B2C customer development, how to think about business ideas, and how to assess a venture’s risk in this 70-page sampler.
Working on a B2B Startup?
Learn B2B customer development with our free email course: